The challenge to me is to go beyond the question of instruction and understanding of different languages. Beyond debates about fitting it within an already crowded curriculum. Instead the focus should be on creating the conditions in which students are able to take action and create new possibilities. Maybe this involves Minecraft, Ozobot or Spheros, maybe it doesn’t. Most importantly it involves going beyond worrying about training or competency, as Ian Chunn would have it, and instead embracing the world of making by leading the learning. - Aaron Davis ‘Did Someone Say Coding?’

In my work, I recently had an issue with absence data where the system had generated some duplicate data. Short of creating an actual report within the system (which I neither have the time or access to do), I decided to have a go at creating a reusable template that I could easily share with anyone. The idea was to take the data and produce a number of specific outputs, including the duplicates and a specific set of ‘All Day’ duplicates.

I started the template by creating a spreadsheet with three tabs: Sheet2, DUPLICATES and ALLDAYDUPLICATES. Sheet2 contained a summary of the ID, event data, name, absence type and event type.

=QUERY(Sheet1!A1:R,"SELECT A,R,E,F,G WHERE A IS NOT NULL")

I then made a column of unique data by combining the ID and event date. To do this, I used Ben Collins’ trick using formulas in a named range as a means of capturing the variability of the data.

=ARRAYFORMULA(CONCAT(INDIRECT(IDS),INDIRECT(DATES)))

With IDS named range being:

="'Sheet2'!A2:A"&COUNT(Sheet2!A2:A)+1

and DATES named range being:

="'Sheet2'!B2:B"&COUNT(Sheet2!B2:B)+1

I then used the column of unique data to create a TRUE / FALSE column as to whether the absence might be a duplicate.

=ARRAYFORMULA(countif($F:$F,(INDIRECT(UNICON)))>1)

With the UNICON named range being:

="'Sheet2'!F2:F"&COUNTA(Sheet2!F2:F)+1

I borrowed this formula in part from Collins who used something similar to use Conditional Formatting to highlight duplicates:

=countif(A:A,A1)>1

In the DUPLICATES tab, I created a QUERY that brought in the duplicates ordered by date

=QUERY(Sheet2!A:G, "SELECT A,B,C,D,E WHERE G = TRUE and A IS NOT NULL ORDER BY B")

While in the ALLDAYDUPLICATES I created another QUERY which focused on ‘All Day Absences’

=QUERY(DUPLICATES!A:E, "SELECT A,B,C,D,E WHERE E = 'AllDayAbsence'")

With all this in place, to query any data, I make a copy of the template. I then import the absence data exported from the external system. Although I could possibly copy and paste the data, I have found that this is fraught with dangers. In regards to the ‘Import Location’ I select Insert New Sheet(s). This then loads the new data into Sheet1. I then click on the formula in Sheet2!A1 and press enter to refresh the QUERY formula and populate the rest of the spreadsheet.

For those interested, a copy of the spreadsheet can be found here.

Growing up, I never really went deep into the world Microsoft Excel. It was not until exploring Google Sheets that I started appreciating the power and potentials. One of the consequences of this is that a lot of the habits that I have learnt are not applicable in reverse. For example, Ben Collins has a site discussing the power of moving from Excel to Google Sheets. This includes a discussion of IMPORT features and the QUERY function. However, there is nothing that I am aware of that goes the other way. I guess this is the nature of coding in general. Every language has its own set of affordances and we work within these constraints. What the situation has taught me though is that sometimes solving problems is about working with what is at hand. I guess the challenge is developing our box of tricks so that we do have something at hand. In some ways, this reminds me of something Amy Burvall once said:

“in order to connect dots, one must first have the dots”

So what about you? What small tools have you created to solve a particular problem? What are the strategies that you use to continually add to your toolbox so that you are always ready when a problem may arise? As always, comments and webmentions welcome.

Free as in Beer
“Free as in Beer” by mrkrndvs is licensed under CC BY-SA

The prompt for the EdublogsClub is associated with technology: Write a post about free web tools.


Every application has its limits. Although Google Drawings offers many possibilities, you are unable to work with different layers or build upon complex templates. Some other applications that can be connected to your Drive or added to the Chrome browser as an extension include:

  • Pixlr – Pixlr allows you to edit images found within your Drive folder. You can use layers, transform objects and apply a wide range of filters and effects.
  • Lucidpress – With a thorough collection of templates to support desktop publishing, Lucidpress serves as a possible replacement for Microsoft Publisher. Along with adding the application to your Drive, to get it properly working you need to link the Google Account within the User Settings. While from an educational point of view, there is also a link to apply for free school licenses.
  • draw.io Diagrams – Designed to support the creation of diagrams and mock-ups within Google Drive, one of the best features of draw.io is that ability to quickly and easily collaborate via the share button. Another similar program is Lucidchart.
  • Sketchboard.io – The purpose of this application is to collaboratively sketch diagrams. This is useful when building ideas, compared with the fluent flowcharts made with draw.io. The only thing to be mindful of is the free account only allows five collaborators at once.
  • Web Paint – Similar to applications like Snag It!, Web Paint is a Chrome extension which allows you to annotate the screen. You can then take a screenshot of the finished product to use in a presentation.
  • Google AutoDraw – An artificial intelligence experiment, which allows users to draw on preexisting images that are suggested based on initial sketches.
  • iPaint – As a bonus, iPaint provides an online version of MS Paint. Although this does not link with Google Drive and may not be the most sophisticated application, it is a useful for those wanting something simpler.

In the end, there are so many free options on the web, whether it be PicMonkey, Method Draw, BeFunkyVectrPhotoFunia, Pizap, Poster My Wall and Canva. Although most of these applications are free to use, they are not “free as in beer”. Maybe it is limitations, maybe adverts, whatever it is there is usually a cost somewhere. With this in mind, It needs to be noted that with many of web apps, you do not always have control over your content. Although you can save copies of images and objects, the originals are often stored somewhere else.

So what about you? What applications have you used in regards to editing images online? As always, comments welcome.

Blogging In and Out of the Classroom with Aaron Davis

Session Description

It is often argued that learning needs to be redefined, transformed into something different. Going beyond what that change may be, a powerful tool that can help drive this are blogs. Originally designed as a means for logging information on the web, blogs have come to take many forms and purposes. This session is about harnessing the power and potential of blogging to develop learning inside and outside of the classroom. Whether you are confused about where to start or what possibilities blogs can offer, this session is for you.  Aaron will provide a range of practical tips and tricks associated with the differences between platforms, how to build a blog from scratch, as well as a range of examples and ideas of how blogs can be used in schools. The reality is, developing creative learners often depends on providing a place for them to shine and blogs is the perfect platform for this.

Here are my slides:

Here is a summary of some other links unpacking key concepts

  • The Many Faces of Blogging: Some break blogging down into tasks or unpacking the response. However, we often overlook the purpose and intent behind them.
  • A Guide to Blogging Platforms and their Niches: A summary of some of the different blogging services available, what they enable and where their biases lie. Included are an array of resources to support.

  • What Makes a Comment?: A question that does not get asked often enough is what it actually means to comment and what might it mean to bring the comment back?

  • A Guide to Following Blogs: A post that explains some different ways to follow a blog, including subscribing, via an RSS Reader or an automated recipe using a platform like IFTTT.

  • A Blog for All Seasons: Different blogging platforms enable different possibilities. Here is an account of some examples that I have created over time.

While here is a full list of  resources associated with blogging

While here is link to my blog roll for those wanting ideas and inspirations. Also a copy of my OPML for those wanting to explore Feedly.

Dictionary.com defines visualisation as:

To make visual or visible.
To form a mental image of.
I would add to this and suggest that to ‘visualise’ is to make visible something that was not necessarily visible before. There are many ways of doing this. Some involve graphs and numbers, while others are more creative in their expression. Here then are some different types of visualisation with possible resources that you can use to create them:

Brainstorm


flickr photo shared by mrkrndvs under a Creative Commons ( BY-SA ) license

A brainstorm is about gathering spontaneous ideas around a specific topic or idea. Although there are many variations, one of the keys is to hold back judgement in order to find the limits. An example of one such variation is NoTosh’s 100 ideas in ten minutes. Some programs to support brainstorming include Answergarden, Padlet, Dotstorming, Socrative, Poll Everywhere and Google Apps. while Richard Byrne has compared a number of options. What is important is the ability to collaborate.

Word Cloud


flickr photo shared by mrkrndvs under a Creative Commons ( BY-SA ) license

An extension of the brainstorm, the word or tag cloud involves visualising text as a cloud. Usually one word at the time, the size of the text is dictated by the amount of times it is represented. Word clouds can also be used to measure the frequency of words in a text. Some programs used to create word clouds include Wordle, Word It Out, TagxedoABCya, Wordclouds.com and Tag Cloud Generator for Google Apps.

Mind Map


flickr photo shared by mrkrndvs under a Creative Commons ( BY-SA ) license

Beginning with a central idea, mind maps involve adding branches and keywords to build a deeper understanding. Colours and images are used to convey more meaning. Although they can be drawn, there are also a range of programs you can use to create mind maps, including bubbl.us, Freemind, Connected Mind, Google Drawings and Mindmeister

Concept Map


flickr photo shared by mrkrndvs under a Creative Commons ( BY-SA ) license

Like the mind map, the purpose of a concept map is to present knowledge. However, the structure is not so rigid. Instead, there is a free form which can lend itself to more complexity. Although the same applications used to create a mind map can be used to make a concept map, some additions include XMind and CMap. See the Software for Mindmapping and Information Organization for more ideas.

Flowcharts


flickr photo shared by mrkrndvs under a Creative Commons ( BY-SA ) license

Flowcharts are a means for visualising processes and workflows. They use a range of shapes, each with a different purpose. A prime example is the representation of algorithms, an essential element of the new Digital Technologies curriculum. Some programs to support brainstorming include Lucidchart, Google Drawings, Gliffy and Draw.io.

Graphic Organisers


flickr photo shared by mrkrndvs under a Creative Commons ( BY-SA ) license

Graphic organisers involve using a visual aid to develop knowledge and understanding. There are many different types of organisers, including relational (fishbone), classifications (KWL), sequencing (ladder), compare/contrast (Venn diagram) and concept development (story web). An easy way to create graphic organiser is with these Google Drawings templates from Matt Miller.

Sketchnoting


flickr photo shared by mrkrndvs under a Creative Commons ( BY-SA ) license

Sketchnoting is about helping us think deeper by mixing, matching and making links using text, image, structure and flow. Some call it visual note-taking, others doodling. For some it is a useful way of summarising different content, while for others it is a creative way to brainstorm new ideas. There are a range of resources and presentations to help with sketchnoting including Sketchnoting FOR Beginners (Silvia Rosenthal Tolisano), Brain Doodles, Sketchnoting for Beginners (Sylvia Duckworth) and How I Teach Sketchnoting (Royan Lee). I have also created a Youtube playlist of useful videos.

Infographics


flickr photo shared by mrkrndvs under a Creative Commons ( BY-SA ) license

A mixture of text, images and data visualisations, infographics are designed to communicate information quickly and clearly. Like sketchnotes, infographics do not necessarily have a set structure. It is however common for them to be long and skinny. This is to fit them within width of a blog. Some programs that help with making infographics include infog.ram, Canva, Piktochart and Google Drawings.

Timelines

Timelines are a means for visualising a period of time chronologically and with a consistent scale. This scale can be days, years, months, it just depends on the topic in question. There are a few applications that allow you to create digital timelines, including Dipity, Time RimeRead Write ThinkTimetoast, TimeLineCurator, MyHistro and TimelineJS. Just note, TimelineJS requires Google Apps.

Comic Strips


flickr photo shared by mrkrndvs under a Creative Commons ( BY-SA ) license

An interpretative visual means of presenting ideas, comic strips often lend themselves to storytelling. Some applications that support the creation of comics include Create Your Own Marvel Comic, MakeBeliefsComix, Chogger, Canva and Witty.

Mash-ups


flickr photo shared by mrkrndvs under a Creative Commons ( BY-SA ) license

Doug Belshaw suggests that, “remixing, re-appropriation and riffing off other people’s work just seems to be part of what we do as human beings.” There are many ways of mashing-up visuals. Often this involves taking something that is used in one context and re-appropriating it for another. This can include making creative maps or adding commentary to an image in the creation of a meme. There are no specific programs used to create mash-ups as there are no specific mash-ups.


So what about you? How do you visualise? What applications have you used? As always, comments welcome.


flickr photo shared by mrkrndvs under a Creative Commons ( BY-SA ) license

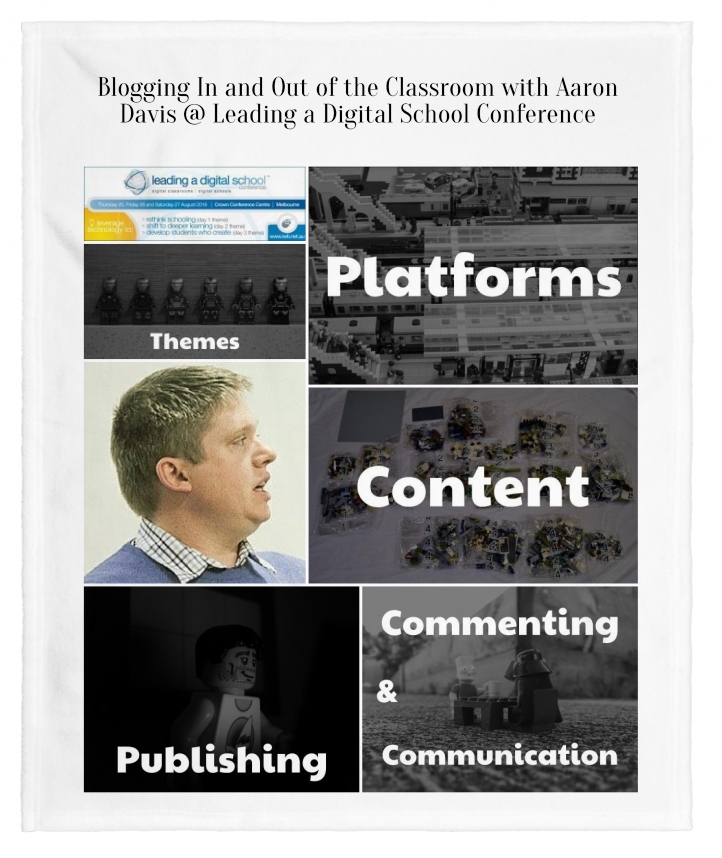
Here is the blurb for my session at Leading a Digital School Conference:

How many fantastic ideas or initiatives have failed not because of the strength of the idea, but because it failed to be heard. Change need not be restricted to the lone nut. This session is about using the power of technology to transform ideas into movements. From sharing a collaborative document to creating an online community, this presentation will be full of possibilities and how they can be used to drive change. Aaron will provide a different way of seeing change and demonstrate how technology is the leverage that every idea needs to go from good to great.

Here are my slides:

Communication, collaboration and creativity exploring the tools of change from Aaron Davis

While here are my notes:

Change, ideas and innovation means many things to many people. For some it is systemic and revolutionary, while for others it is more gradual and occurring each and every day. I feel though that Ewan McIntosh sums up the dilemma best while discussing the concept of the ‘pilot project’, “The ‘beta version’, of our idea is, in fact, an ever-changing final idea. There is no such thing as a pilot.” The reality is change is inevitable. Some ideas take, others are added to the heap. The question then is how do we come up with great ideas and actually make them happen?

One of the enablers of change is technology. As Seth Godin explains in his book Tribes, “The tools are there,  just waiting. All that’s missing is you, and your vision and your passion.” This flourishing potential allows for an amplification of ideas and inspiration. For Simon Sinek states, “There are leaders and there are those who lead. Leaders hold a position of power or influence. Those who lead inspire us.” The question then is: how might we better utilise technology to support change in order to turn ideas into innovations?

It can be hard to make sense of the plethora of applications on offer. To do so, I have divided things up into three categories: communication, collaboration and creativity.

Communication

Social Media: The obvious place for communication online is through various social media platforms. Whether it be Google+, Facebook, Twitter, Nings, Edmodo, LinkedIn or Scootle Community, each offers its own benefits and possibilities. Whether it be using communities in Google+ to share ideas and resources or the power of the hashtag within Twitter to facilitate a world-wide chat, the challenge is to find what works best for you.

Streaming: In recent times, there has been a real rise in streaming applications. Originally, video streaming was limited to programs such as Skype, Google Hangouts and Blackboard Collaborate, but more recently, there has been a rise in different sorts of platforms for streaming content live, including Periscope, Meerkat and Ustream. In addition to that, Voxer, a digital walkie talkie application, has had a dramatic influence on communication. I think that Joe Mazza puts it best when he describes it as his “very own personal podcast”.

Surveys: There are a range of applications which make receiving ideas and feedback so much easier, whether it be Google Forms, Survey Monkey, Verso and Poll Everywhere. Each application has its own intricacies, such as Forms integration with the Google Apps and Poll Everywhere’s real-time engagement.

Splash Page: It is often stated that if you do not tell your story then someone else will tell it for you. One way of telling this story is through a splash page. The most common splash pages are About.Me and Flavors. However, you can just as easily make a splash page using a static blog or as using Mozilla Thimble.

Collaboration

Editors: The most obvious tool for collaboration is via a text editor of some sort. The usual suspects are Google Apps, Microsoft Onenote, Evernote and Hackpad. Each allows for multiple voices in the one space. Although it can be easy to get caught in a debate about which one is best, it can sometimes come down to what the community in question is comfortable with. Another alternative though Padlet. Although limited to texts, images and attachments, sometimes such constraint makes it easier to focus.

Bookmarking: There are many ways to share and collaborate on ideas and information. One answer is through the use of social bookmarking sites, such as Diigo, Delicious, Pearltrees, Pinterest and Educlipper. Each platform allows you to not only add and organise content, but scroll through that which is already there to find information.

Curation: For many social media is too noisy. The challenge then becomes how to manage and curate such streams of information. Curation applications, such as Flipboard, Zite, Feedly, Pocket and Nuzzel, provide a means of benefiting from the room without completely being in the room. These platforms usually require some sort of information from the user, whether it be interactions within the app or connections to other platforms, such as Twitter, in order to provide customised content.

Productivity: A different sort of collaboration is through the management of projects and ideas using productivity applications like Trello and Slack. Another useful tool for managing a hashtag is Tagboard as it allows you to search across different platforms.

Creativity

Video: There are many ways to create video beyond simply recording yourself. Maybe it is screencasting with Snagit, Screencastify or Camtasia. Another option is presentations and animations using Powtoon and Adobe Voice. An alternative to the usual medium is creating a GIF image or a Vine.

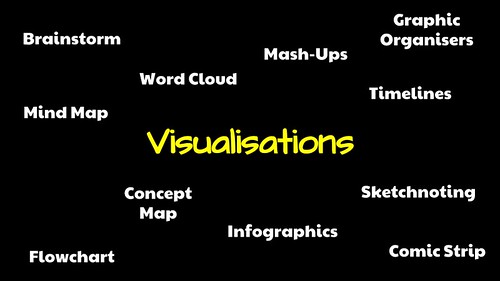
Visuals: As the adage goes, a picture is worth a thousand words. Although I am not completely sure of that, there are many ways to at least marry both using technology. Maybe it is creating a more visual presentation with Prezi, capturing a moment with Instagram, creating an image with Canva or sketching with Paper53.

Blogging: In his book, Smarter Than You Think, Clive Thompson states that, “Just as we now live in public, so do we think in public. And that is accelerating the creation of new ideas and the advancement of global knowledge.” One medium which has made such public thinking possible is blogging. There are a range of platforms, including Blogger, WordPress, Tumblr and Medium. What is important to remember about blogging is that it does not just have to be ‘text’. There are so many different products that can be embedded, such as Padlets, Soundcloud, Storify and Youtube.

Spaces: In addition to blogs, there are many applications which allow you to create pages on the web. Some options include Glogstar, Google Sites, Weeby, Wix, Wikispaces, Adobe Slate and Smore. Each of these sites offers their own benefits, whether it be the visual nature of Glogstar or the simplicity of Adobe Slate.


Tim Kastelle suggests that, “If there is a gap between where you currently are and where you want to be, the only way to bridge it is by doing something new. Innovating.” Technology can help in bridging this gap, but as Kentora Toyama states, it only ever amplifies whatever capacity is already there. So, what change are you driving and what technology are you using to enable it?


For the backstory, the student code for the Verso provocation is: EE5YVK

The link to Padlet is: http://padlet.com/aarondavis/digital15

A teacher at school saw me sketching away during the PD and asked me what apps I use in the iPad to support teaching and learning. Having recently been given an iPad as a part of her leadership role, she was wondering where to start. Instead of writing a simple list of applications, I thought that it might be better to go through those apps that I go back and what I like about them:

Sketching

Inspired by the work of +Amy Burvall I have really taken to sketch noting of late. This has come to include my own professional learning notes , but also as a portable whiteboard for small group group. Initially, I was using Inkflow. However, I have since moved to Paper by FiftyThree. A couple of things that I really like are the ease of drawing and the ability to zoom in and out. The one thing that I have found important though is the use of a stylus. Although you can use your finger, using a stylus is so much better.

Organization

What I love the most about using the iPad is its portability. Whether it be capturing visual or audio information or taking notes, I often start with Evernote. I like that I can then open things up on other devices, such as my phone and computer. In addition to this, I also use Sheets for recording information and Docs for working on planners. Since the ability to access offline documents was added, this has changed the way I use Google on the iPad. More recently, inspired by a post from +Steve Brophy, I have started using Trello to organise myself. What I have found most useful about it is the ability to forward emails to different boards to create new notes.

Reading

In regards to engaging with written texts on the iPad, there are two different aspects: texts that I find elsewhere and read on the iPad and texts that apps bring to me. In regards to reading texts from elsewhere, I use iBooks for epub texts as the app allows you to search, annotate and email information. In regards to PDFs I use Documents as it not only allows you to search and annotate, but also link to Google Drive where I often save PDF documents to. In regards to consuming texts that comes to me my first port of call is Feedly. I have a quite extensive list of blogs which I follow. In addition to this, I often send interesting links from Twitter, YouTube and Google+ to Pocket. Linked with this, I have recently started using Lisgo to listen through the various posts in Pocket. Although many swear by news aggregation apps, such as Flipboard and Zite, they are still often my last port of call, while sadly I find Diigo frustrating on the iPad.

Images

In addition to sketching, I use a range of apps when working with images. There are a few apps that I often go to in regards editing images, including Vintage Scene HD and Comic Book!. In regards to creating images, my go to apps are Phoster and Meme Generator. An app from left field in regards to the creation of images is Foldify. This app actually allows you to create and colour 3D shapes. In regards to storing all these images, I usually use Flickr to not keep them, but assign them a creative commons licence.

Presentations 

For presentations, my go to is Haiku Deck. Not only is the platform smooth and simple, but it also allows access and attribution to a wide range of creative commons. Another app that I have come upon recently is Adobe Voice. Like Haiku Deck, Adobe Voice not only allows access to creative commons images, but also the ability to record audio to support.

Now I know that there are others, such as Google Hangouts and Edmodo, that I use that I have not mentioned. However, I use them more on my laptop so I didn’t really feel that they earn a mention.
 
So what about you? What apps do you use? Is there anything that you would recommend? Would love to know.